In the life of a digital data analyst there comes a time(or many a time) when varification of exactly what is being tracked by Google Analytics or Adobe Analytics. This is where Omnibug comes in.
What is Omnibug
Omnibug is browser extension (for Chrome and Firefox) that makes it very easy to inspect the data packets that are sent across to your web analytics provider of choice
There are many reasons why you would want to see what kind of information is sent and when, including:
- To see what actions trigger an event firing
- To see what data is captured alongside or at certain events
- Confirm the relevant data is being captured
Using Omnibug
Once Omnibug is installed in your browser, it can be accessed by opening “Developer Tools”. There will be a tab in the Developer Tools window called “Omnibug” which can be selected.
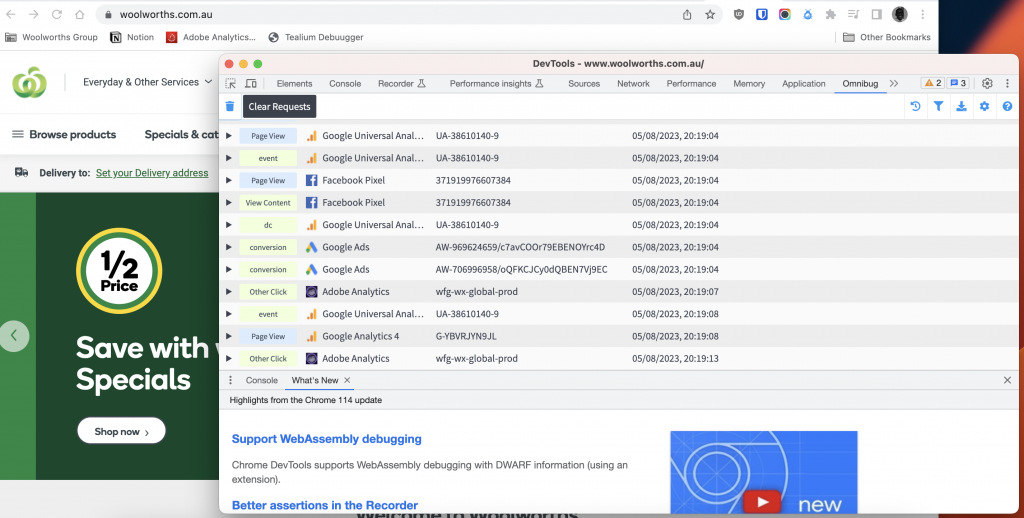
With the Developer Tools open and Omnibug tab selected, tracking requests made by the web pages visited will appear in the list. Each row in the Omnibug tab shows each time a packet of information is sent across to a web analytics provider.
In addition, each row can be expanded to see exactly which data is being sent across in each hit.
Omnibug can be used to inspect the data within a wide range of digital web tools including:
- Google Analytics
- Adobe Analytics
- Facebook Pixel
- Google Ads
- … and many more
The list of hits Omnibug displays can be filtered down based on source. For example it is possible to only show Adobe Analytics hits:
Live interaction is great, but there are cases when it is necessary to be able to record what data is being sent for later analysis or review.
In these situations it is possible to export the data Omnibug is showing, either to a csv file or a tsv file:
2 thoughts on “Omnibug – Part 1”