This guide will walkthrough how to create automatically updating Google Analytics reports.
This is for those who need to report on Google Analytics data regularly, and need to get access to the actual data to they can present the data in their own powerpoint or excel or other report.
As user friendly as Google Analytics is providing screenshots as reporting is unlikely to wow anyone.
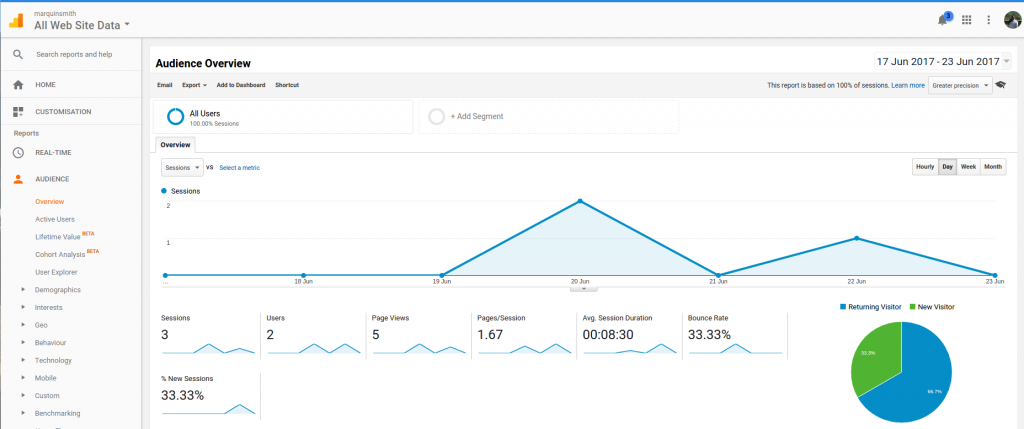
Prerequisites:
- Google account linked with a Google Analytics account
and that’s it! So once you have that let’s begin…
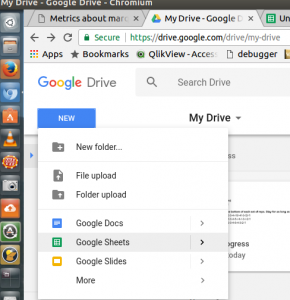
Create a new Google Sheets spreadsheet in Google Drive
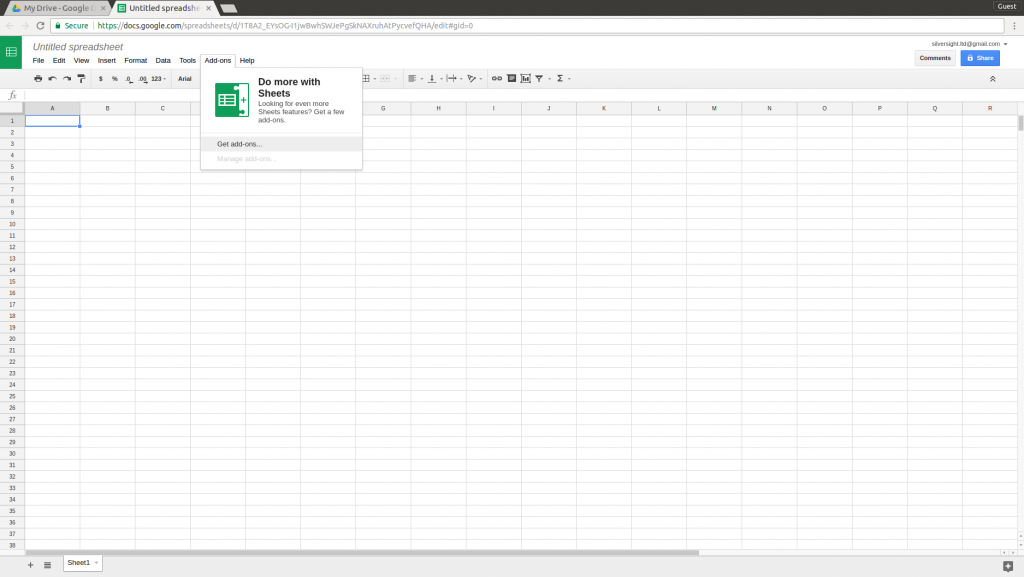
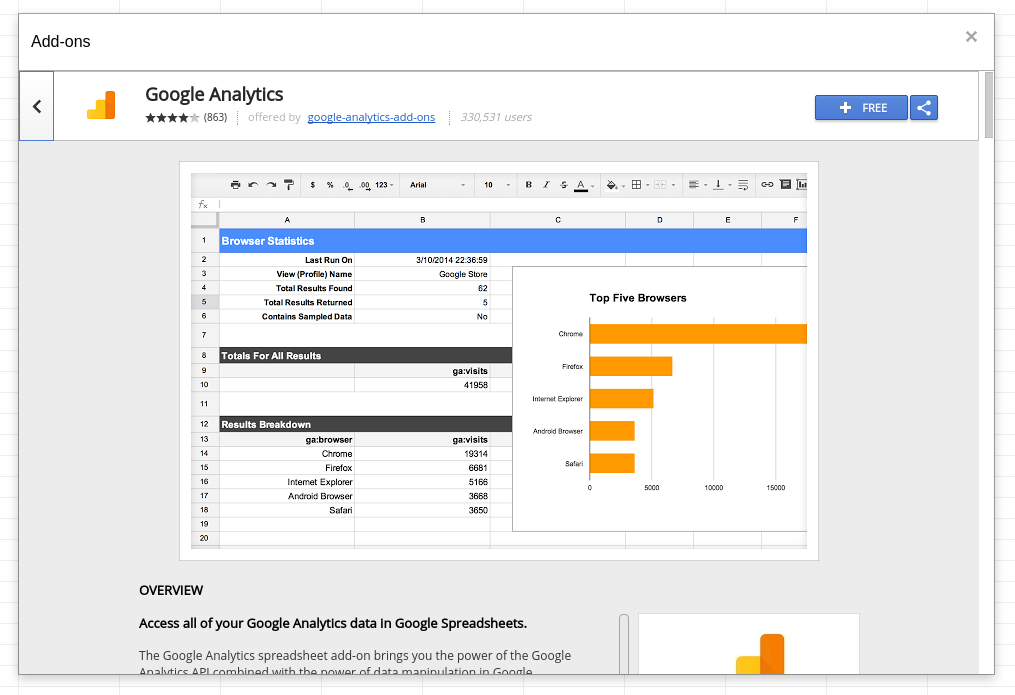
Get the Google Analytics addon for Google Sheets
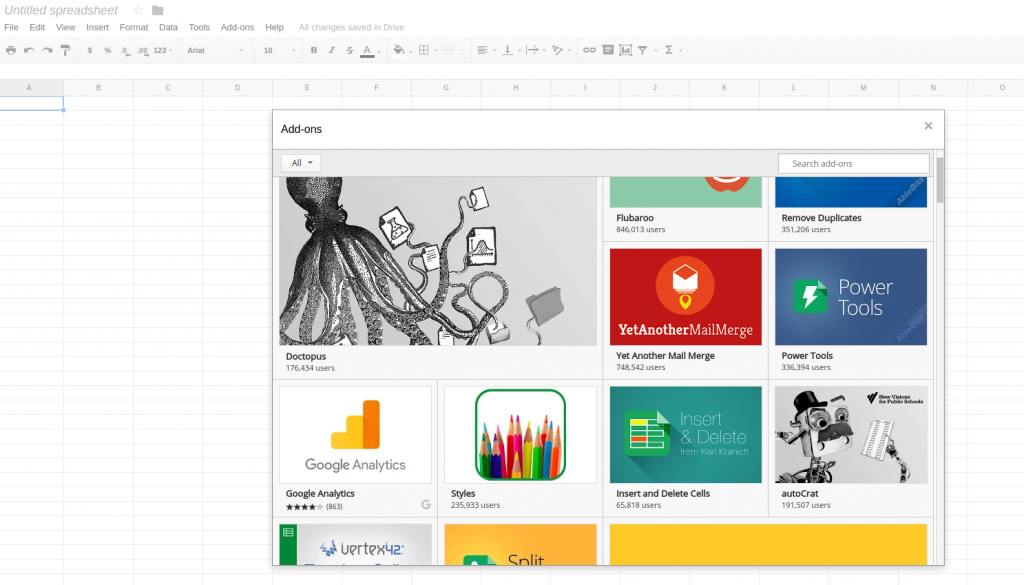
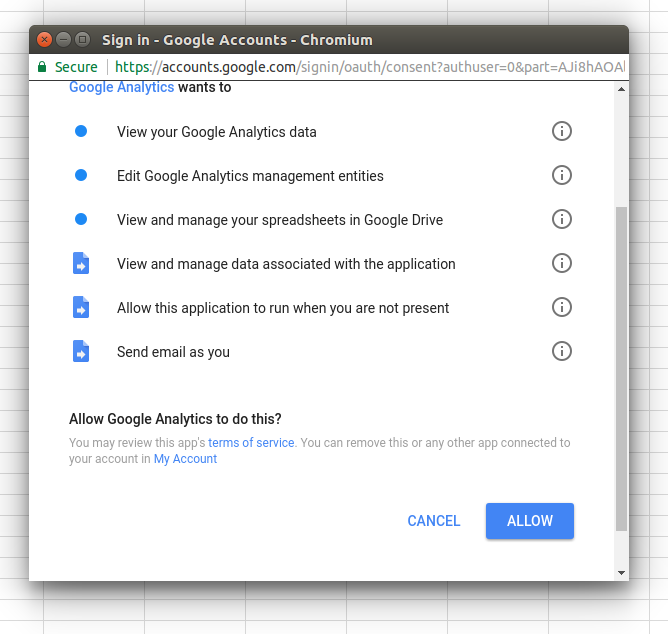
Allow the addon to access your Google Analytics data
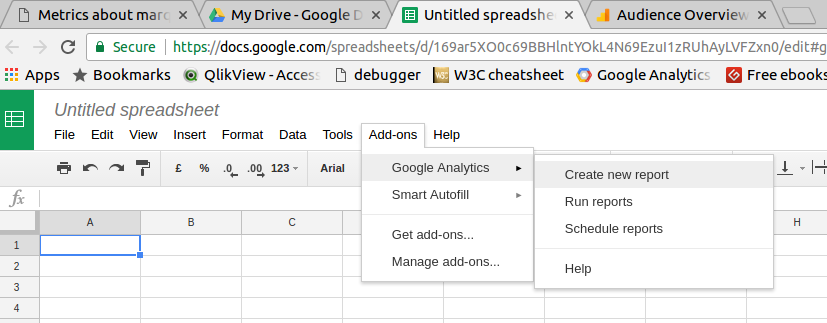
Select “Create new report” in the newly available options under Add-ons –> Google Analytics
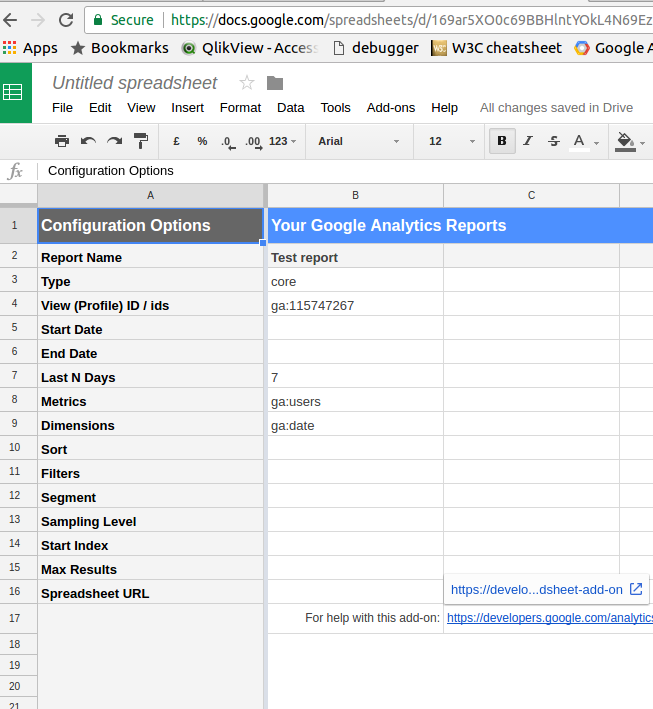
Fill in some parameters for the report you want to run. Don’t worry about getting it exactly right here you will have chance to fine tune the report settings later on.
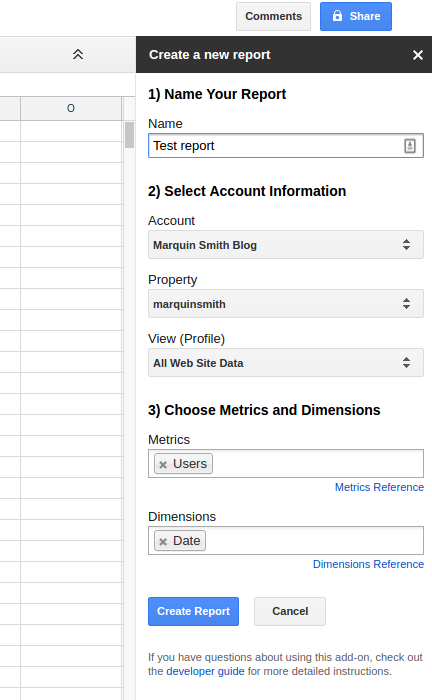
Fine tune your report here further if you need to. There are many metrics and dimensions to choose from in Google Analytics. Google have conveniently created a Google Analytics explorer where you can play with various combinations. Reference materials for metrics and dimensions are also available to clear up any uncertainties.
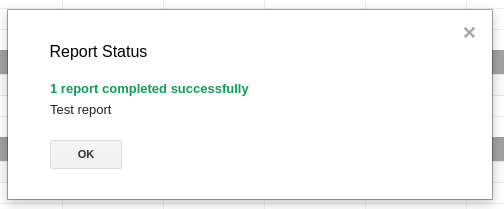
Run the report, and if there are no issues it should be a success
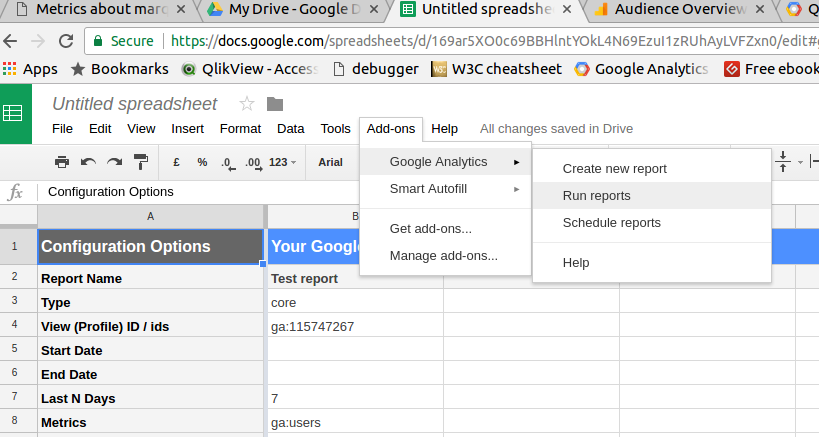
And finally schedule the report to run when you want it to.
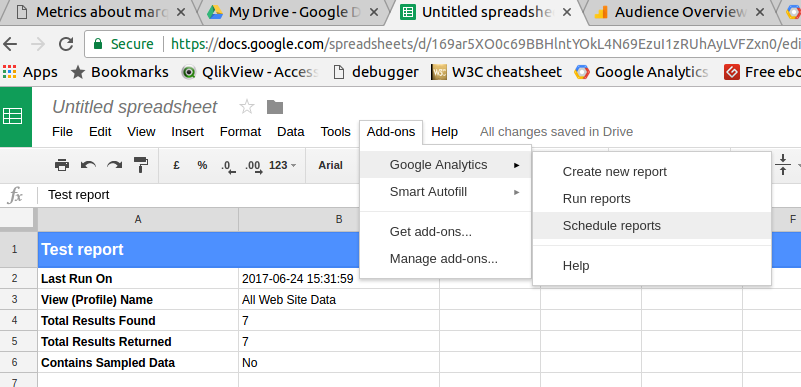
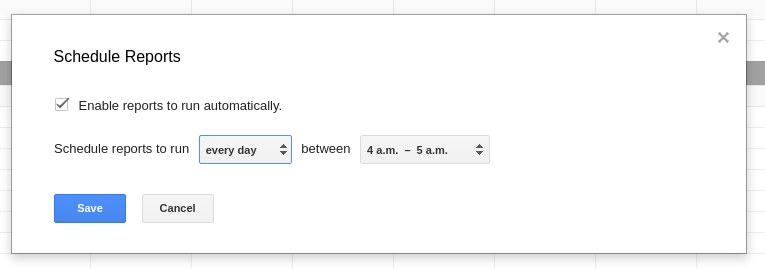
If you have followed along up to this point you now have an automatically updating Google Analytics report, and not a single line of code was written!
Once you have this is place this really opens up some interesting possibilities for reporting:
- Build an excel template where you can drop the output from this report and a dashboard or graphs will update.
- The same as 1 but within Google Sheets environment. In fact the chart on this page was made in Google Sheets and embedded in the post.
- Using Google Sheets as a data store for other online dashboards such as Cyfe or Gecko Board which can connect to Google Sheets to access the data within.