A quick addition to my previous post “Debugging Adobe Analytics“, this is a quick guide to detecting Adobe Analytics calls on Google AMP pages.
Chrome
In Google Chrome it is possible to emulate mobile devices by doing the following
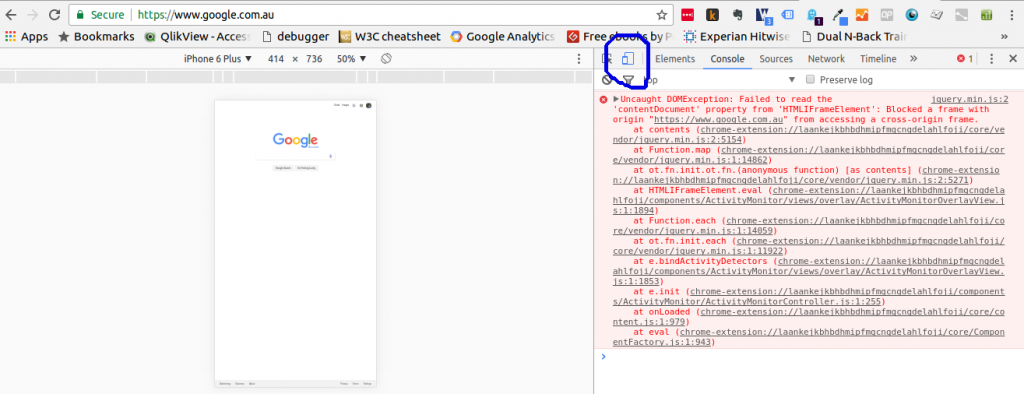
1. Once in developer tools click on the icon of a phone and tablet.
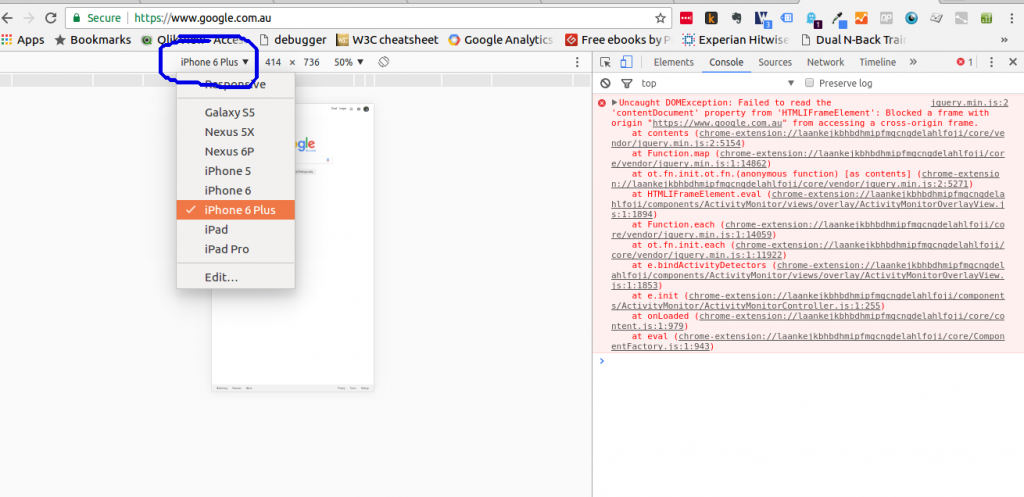
2. From the dropdown menu that now appears select the device you would like to emulate
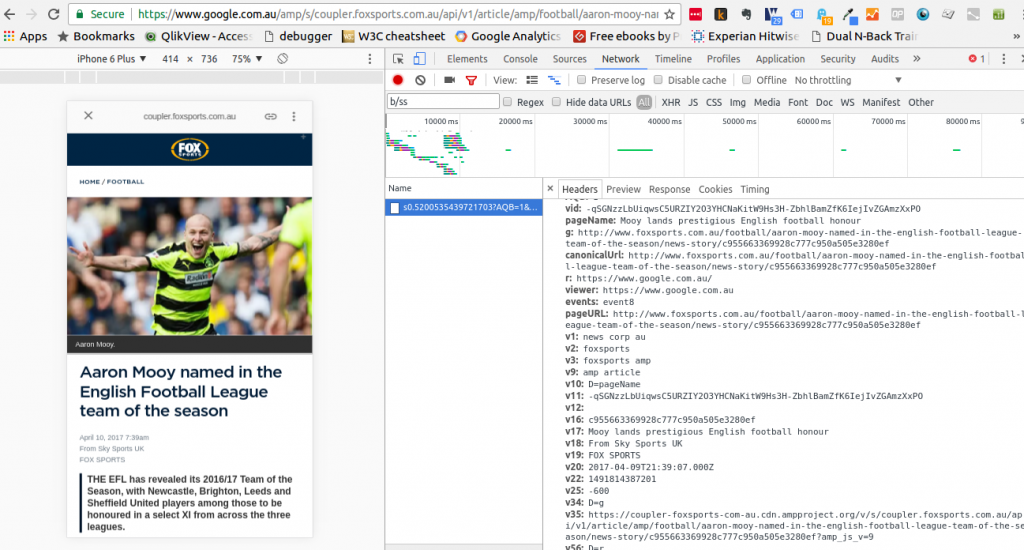
3. Once we are in full emulation mode in Chrome now we need to find an article on Google AMP to test. A bit of Googling may be required to find a live one.
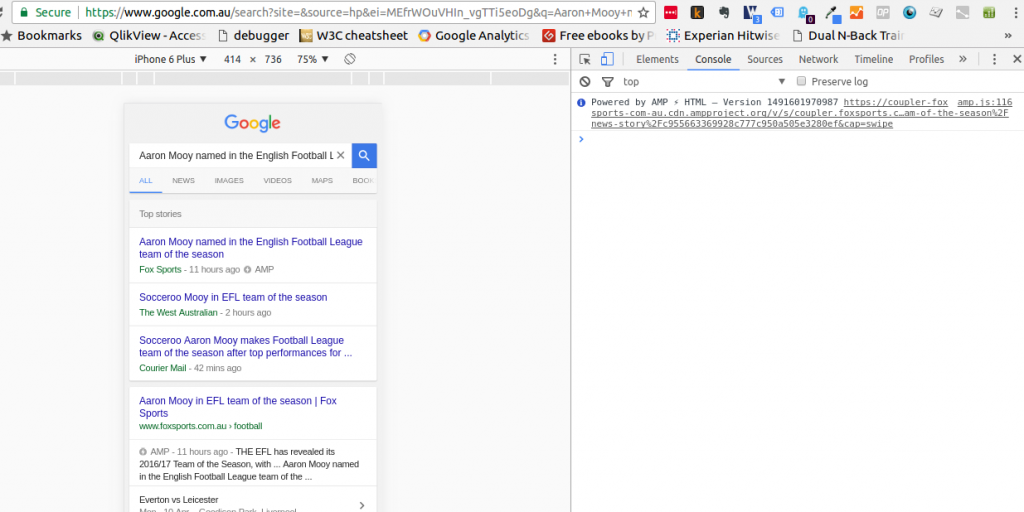
4. After selecting the appropriate AMP article lets go in the Network tab in the developer tools and search for “b/ss” to find the Adobe Analytics call.
Firefox
Steps 3 and 4 in firefox will be the same as Chrome so we will only go through emulating phones using the Firefox browser.
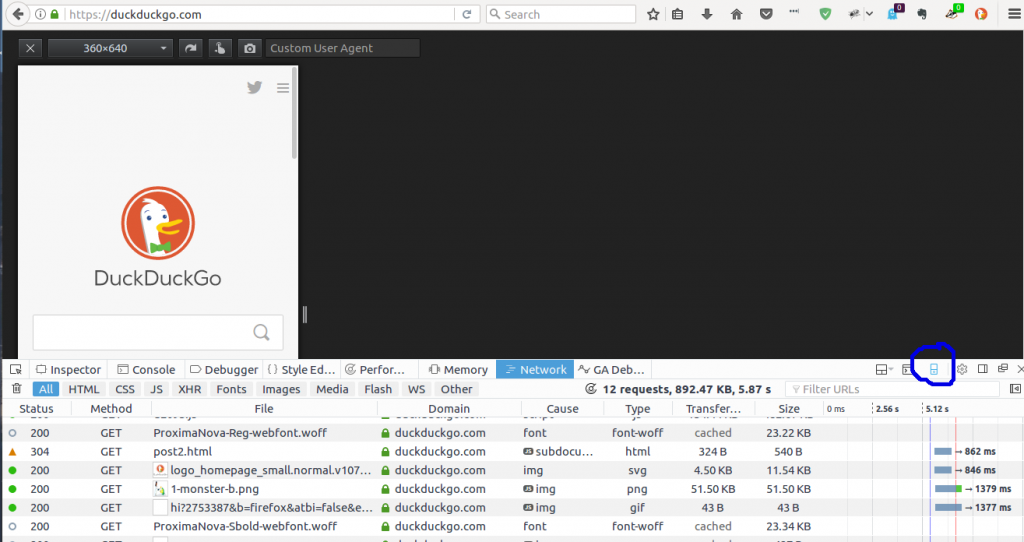
1. Hit [ctrl] + [shift] + [i] to open up the developer tools in firefox. Clicking what looks like an ipod icon will put us in the right mode to start emulating.
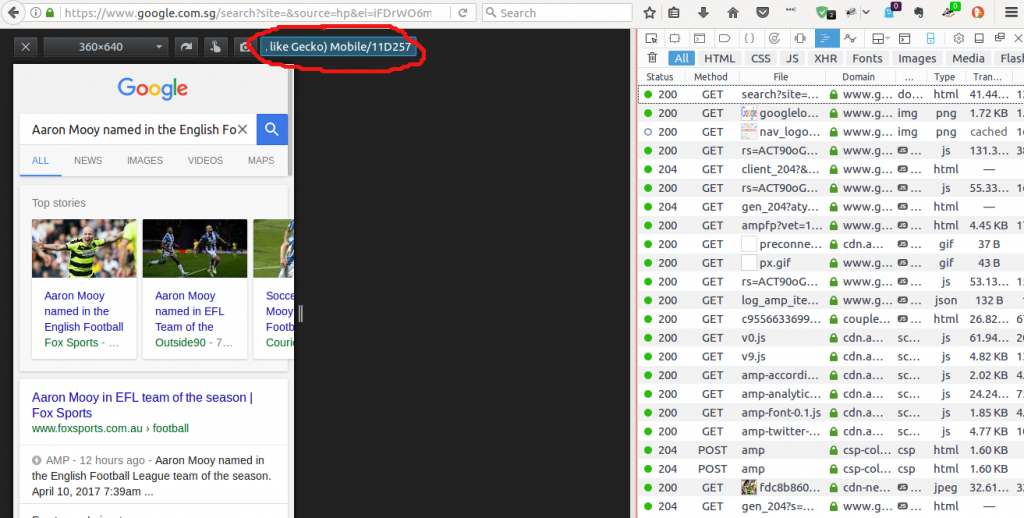
Now this is where Firefox gets a bit more complicated than Chrome. The box near the top of the page that says “custom user agent” is what you want to focus on.
This awesome link from zytrax lists out all the different user agent strings that will allow you to see how the page would respond to a wide range of devices, from Nintendo Wii to some old school Nokia devices.
Lets stick with a trusty iphone
Mozilla/5.0 (iPhone; CPU iPhone OS 7_1_2 like Mac OS X) AppleWebKit/537.51.2 (KHTML, like Gecko) Mobile/11D257
Now just follow the same steps 3 and 4 from the Chrome section
Happy debugging!