In my current role I am in a small part responsible for accuracy of the web analytics tracking. One of the tools we use is Adobe Analytics. At my company we are constantly rolling out new developments and features across the site. In order to understand how these new features are performing we need to track various metrics, and ensure these are tracked correctly and accurately.
Failure to ensure the data collection process is correct means that you wouldn’t be able to trust any analysis coming out of the other end, or in other words
GARBAGE IN == GARBAGE OUT
There are a few ways to detect if there is an Adobe Analytics tag on the page and exactly what information is being passed with each call.
Ghostery
Ghostery is a browser plugin that allows you to see all of the Analytics, Social Media, advertising tags that are on a page.
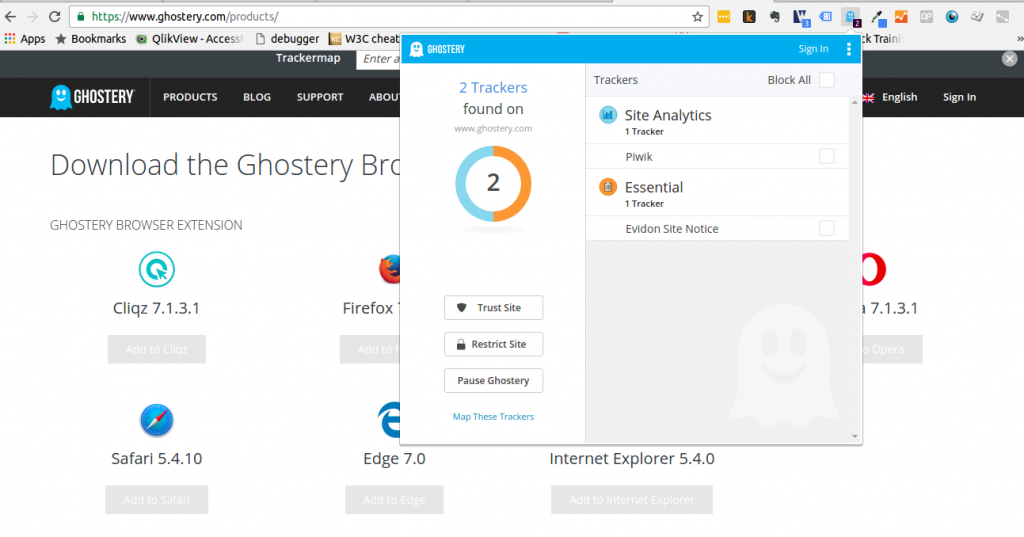
This is a handy tool for quickly seeing what kind of tags are on a page. If you are more privacy minded you could also configure Ghostery to block any and all of the tags it finds.
How does Ghostery make money I hear you ask, well if you opt in Ghostery will send data back to home base about all the tags you stumble across while browsing. The people at Ghostery will then package this data up and sell it to third parties.
That being said Ghostery is a great tool for quickly checking what tags a page has. Let’s see if we can find the Adobe Analytics tag on Fox Sports.
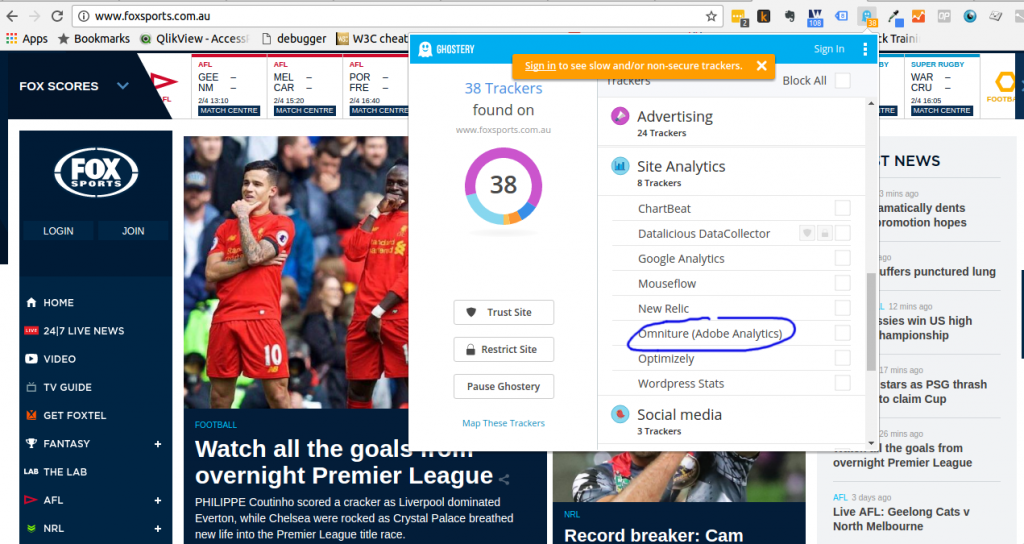
Great! We found the Adobe Analytics tag! That’s a start, but how do we know all the correct metrics are being tracked?
Adobe Debugger (official)
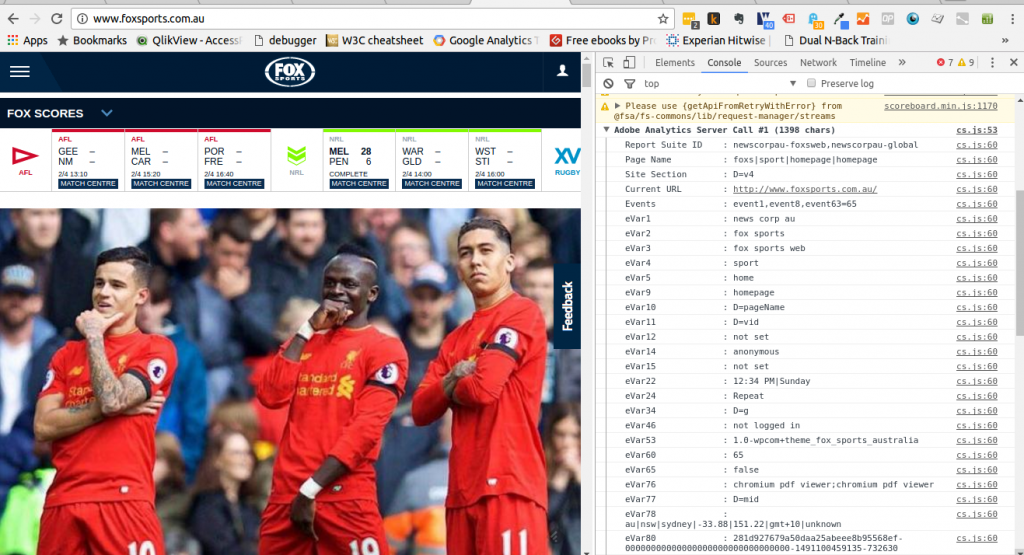
The Adobe debugger is a neat little tool from Adobe themselves which allows you to see what parameters are being passed to Adobe with each call of the Adobe Analytics script that is on the page.
The output from Adobe debugger looks like the following
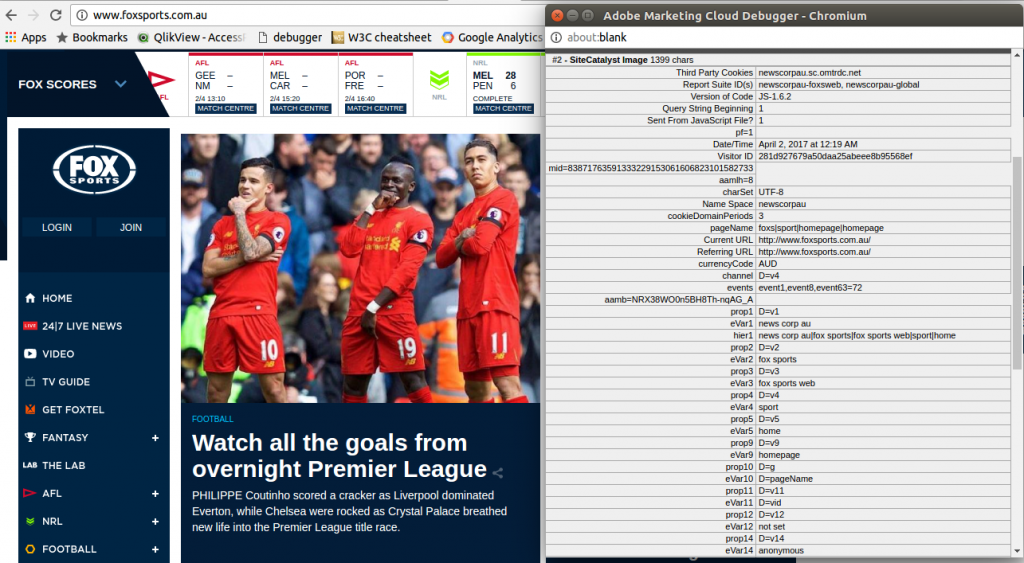
In the above the parameters are nicely printed and formatted for easy inspection.
For more details on this check out this post from Adobe themselves about this Adobe Analytics Debugger. Installation instructions can be found in this video.
Adobe Debugger (unofficial)
For those users of the chrome browser there is a chrome extension which prints to the console the data that is sent to Adobe Analytics.
Slowly moving onto more hardcore web development techniques now. This one requires you to open the console in the Chromes Development Tools.
Once in the console with this add on enabled you will be able to see all the parameters that are being passed.
Monitoring Network Traffic
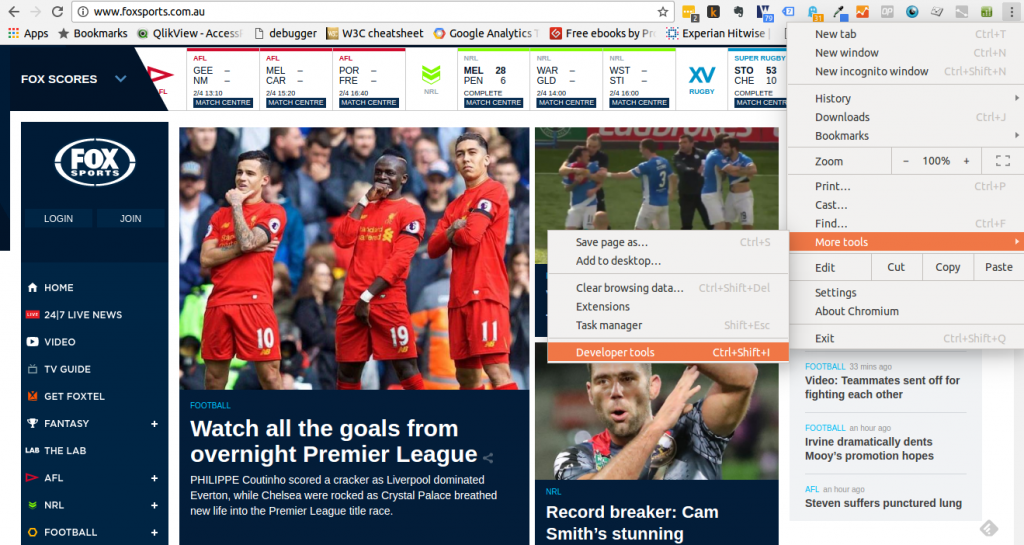
Chrome
Now we know how to access the Developer Tools in Chrome we can simply jump across to the network tab to see all the requests made by the page.
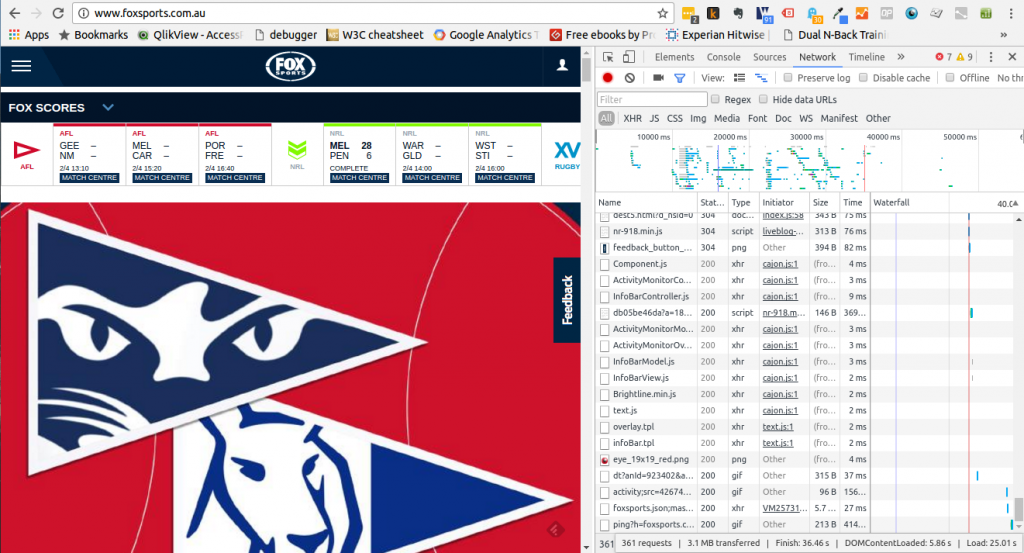
To find the Adobe Analytics call in the filter we can search for “b/ss”
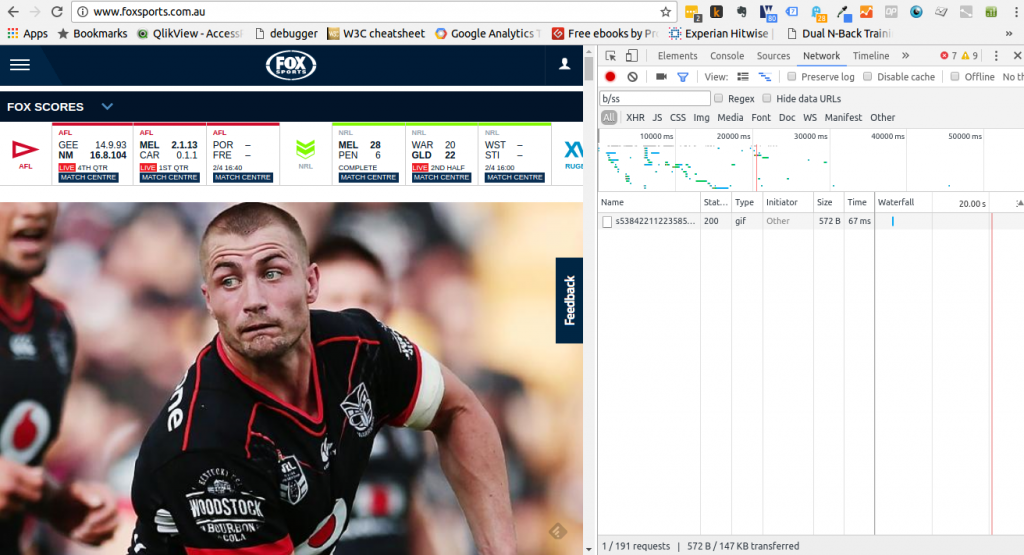
One great thing about doing it this way is that if you are worried that multiple calls are made then it will be clear to see. Each Adobe Analytics call will have its own row in the Network panel so you can clearly see how many there are.
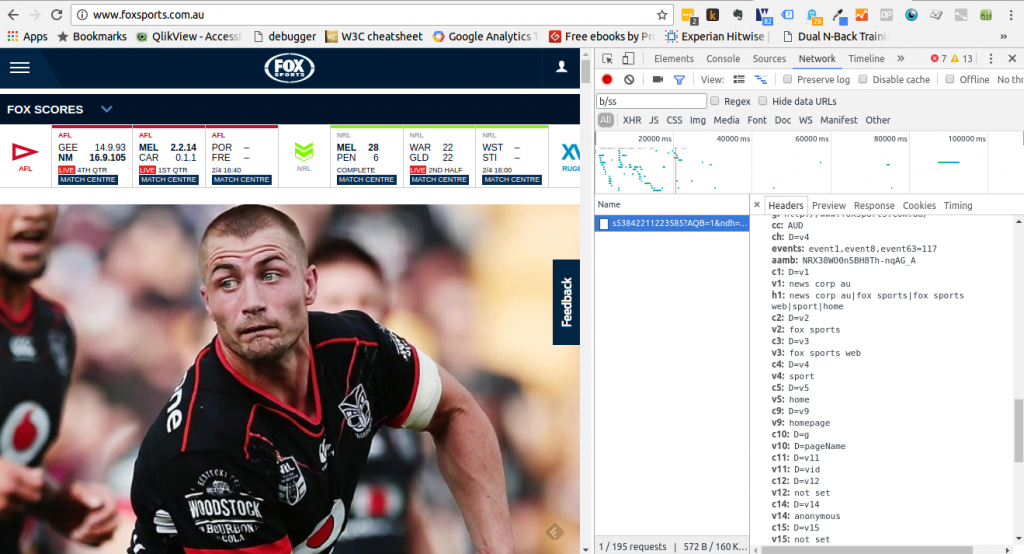
Clicking on a row will show you more details of that particular call (in our case this particular Adobe Analytics call), you will just have to scroll down a bit to the ‘Query String Parameters’ section to see them in detail.
Other Browsers
A similar process can be followed to investigate network activities in other browsers. All you have to make sure you do is search for “b/ss” in the network activity once you have found this in your browser of choice.
But what if I want to check multiple pages
What we have covered so far is great to double check single pages, however what if there are a whole range of pages we want to check, having to check them all manually is not ideal.
I know there is a paid service called ObservePoint which as far as I can tell are a pretty good outfit. Alternatively there is Selenium which allows you to programmatically control browsers for exactly the kind of wide scale testing described.
I would probably go down the Selenium route because I think it would be super cool to build an automated tag testing framework from scratch! If I ever get that far I will be sure to share it.
Some browser plugins **cough** adblockers **cough** may affect the firing of analytics scripts so ensure you have these turned off when performing these tests so you can detect everything uninterrupted.
One thought on “Debugging Adobe Analytics Tagging”